Me as a
Project Manager
running Metro Metrics
An open walkability score for any location, built from public map data, and the five-person team I took from a project charter to a live demo.
The problem
Walkability scores exist, but you cannot see inside them
Walkability is an important factor in quality of life, accessibility and urban planning, but it is usually communicated through opaque or proprietary scoring systems. Individuals, students and planners lack transparent tools that let them explore how different amenities, distances and priorities contribute to walkability in different locations.
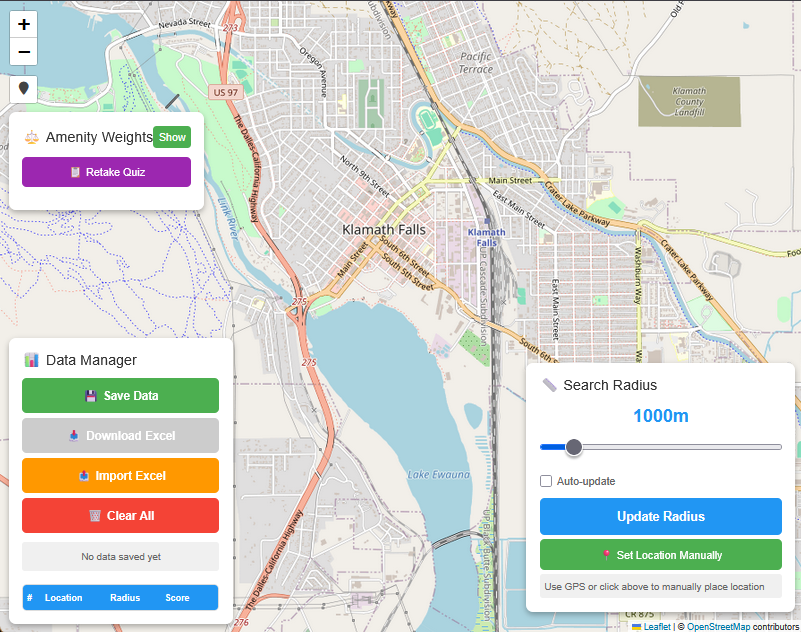
Metro Metrics is an interactive web tool that calculates a walkability score for a location the user picks, by analyzing the amenities nearby, grocery stores, parks, schools, public transit and more, using open geographic data. It gives people an open, customizable score built on public data, so they can understand how their environment supports everyday needs.
My role
Project manager, from the charter to the closing
I led a five-person cross-functional team through a full PMBOK-style project lifecycle: initiating, planning, executing, monitoring and controlling, and closing. I wrote the project charter, built the work breakdown structure, developed the schedule, identified the risks and how we would handle them, and drafted the data management plan.
Week to week I ran and facilitated the team meetings, kept detailed meeting notes, tracked progress against a Gantt chart, and held regular check-ins with our mentor. I was the central point of coordination between every role on the team, from the initial scoping through the final stakeholder presentation and live demo.
The outcome was a working interactive web application, a live demo, and a final presentation to course stakeholders at Oregon Tech in winter 2026.
The team
- Ariella Marchuk, project manager.
- Anesti Audeh, tech lead.
- Erin Uhl, editor.
- Landon Hunter, communication lead.
- Addy, creative lead.
What I owned
- Project charter and stakeholder identification.
- Work breakdown structure and project schedule.
- Risk register and mitigation strategies.
- Data management plan.
- Weekly meetings, meeting notes, Gantt tracking, mentor check-ins.
The model
Three rules turn nearby amenities into a score
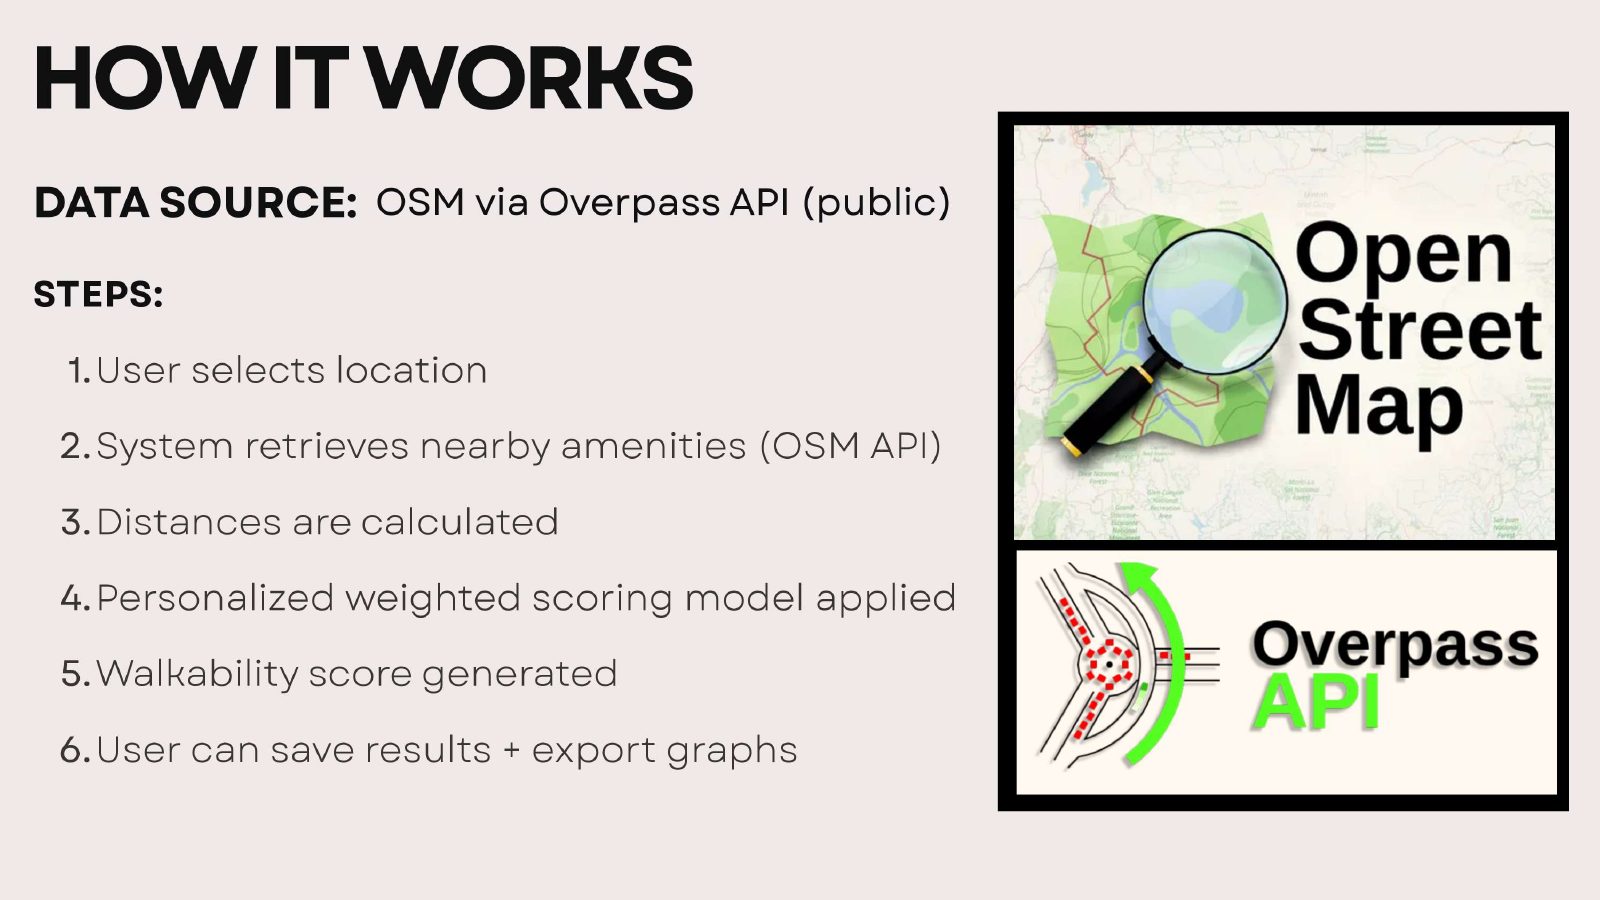
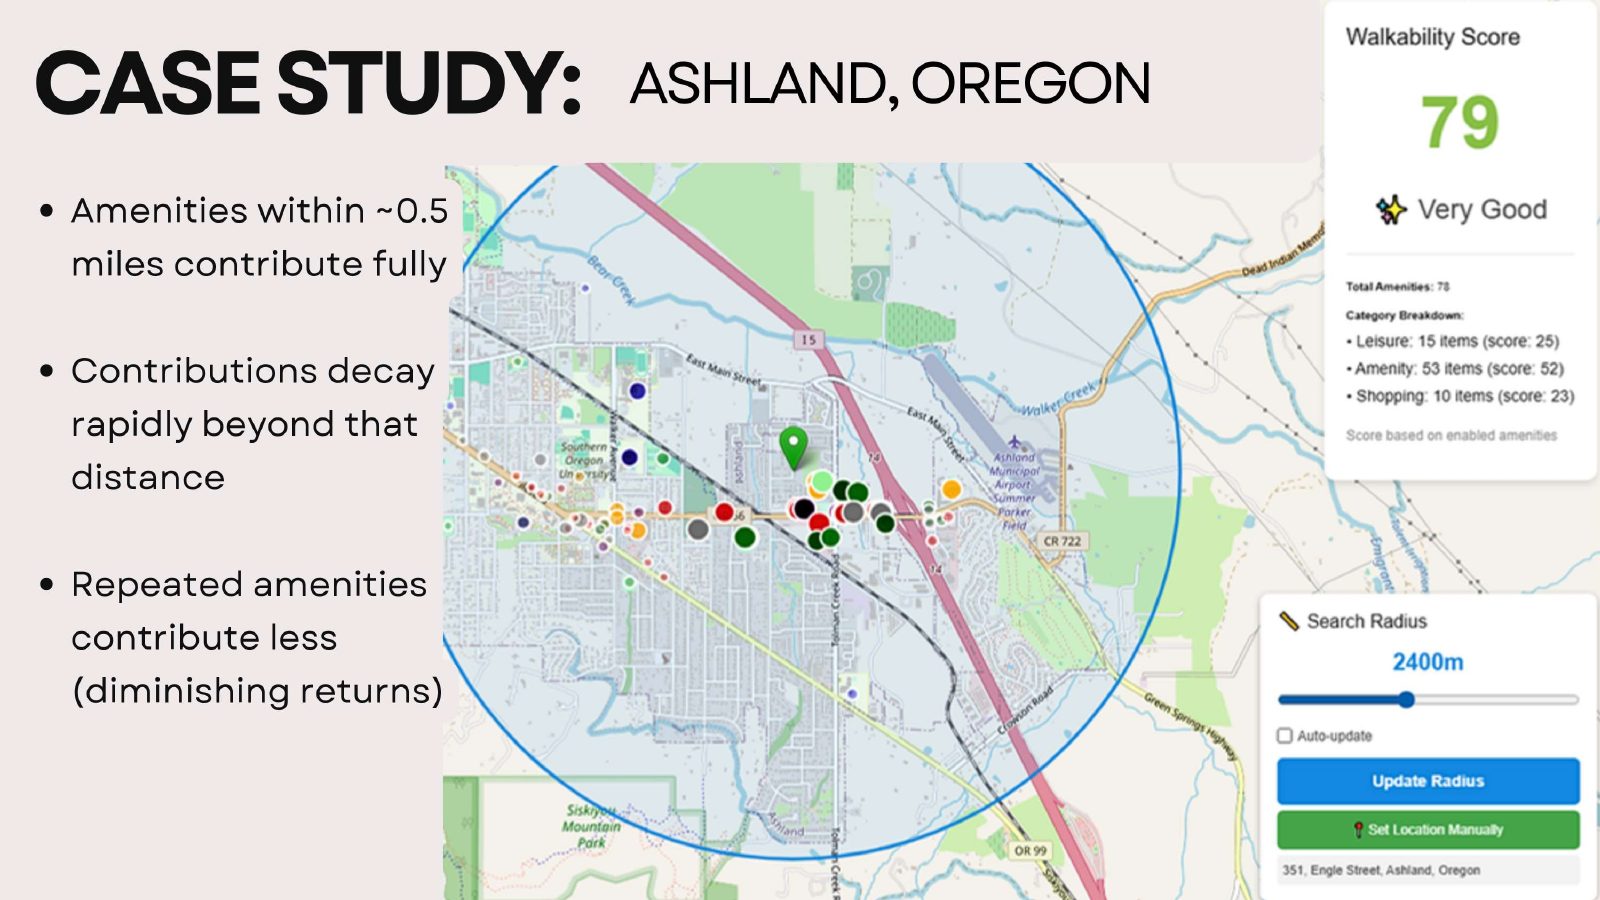
Everything comes from public data. Amenity, leisure and shop locations come from OpenStreetMap through the Overpass API, Nominatim turns coordinates back into street addresses, and the browser's geolocation API supplies the user's own location when they allow it.
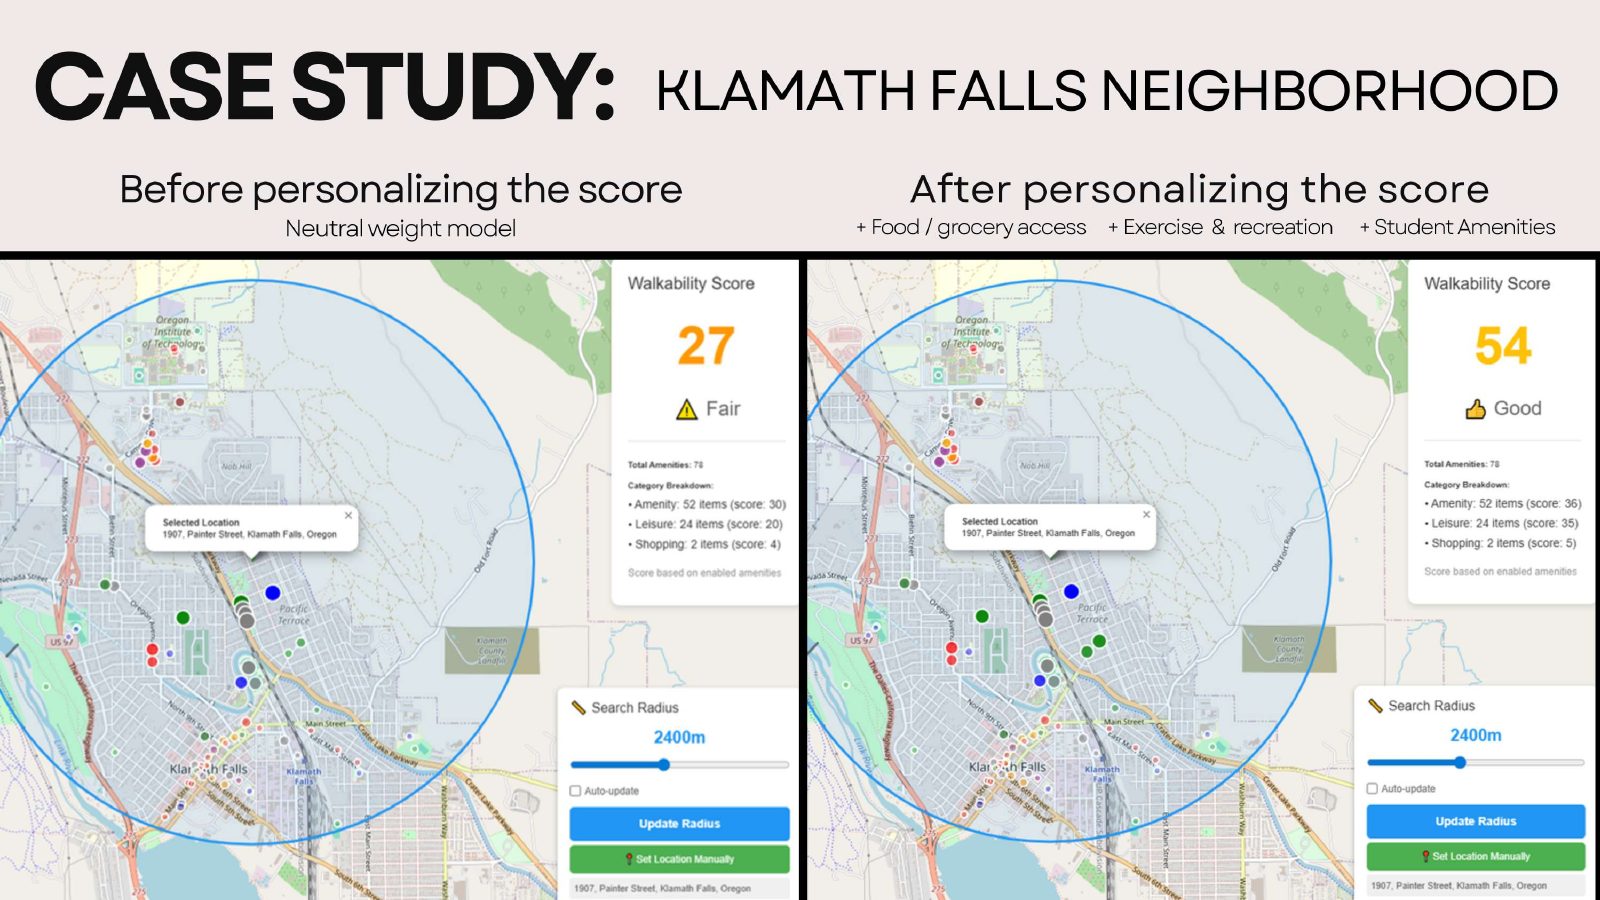
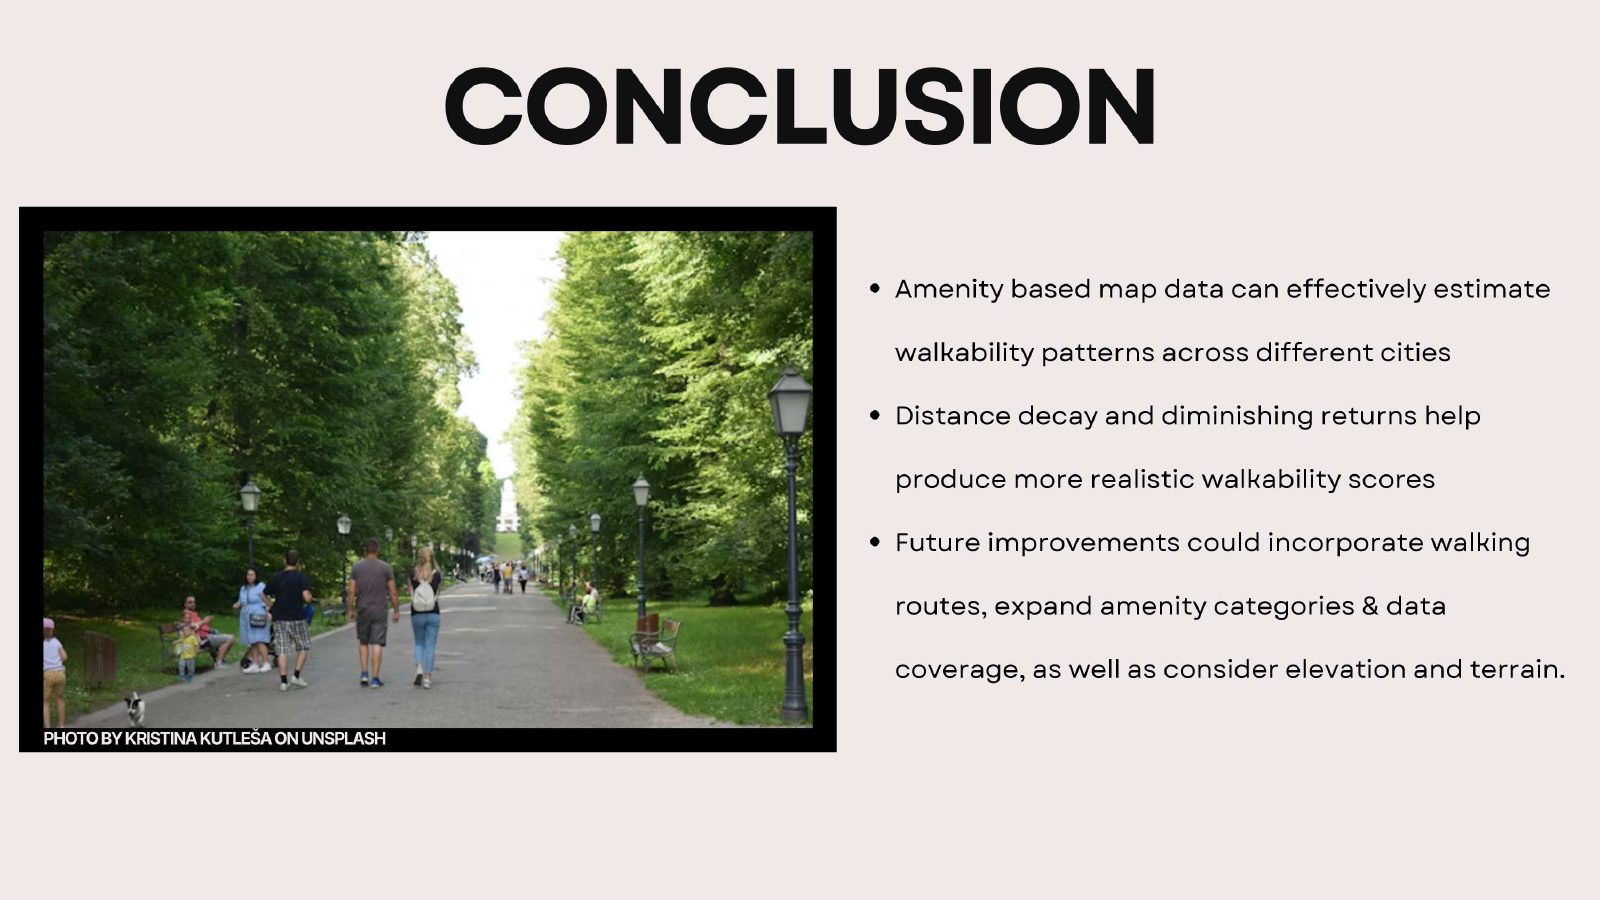
The score, from 0 to 100, is built from three rules. Proximity decay, so that amenities closer to the selected location count for more, with a rapid dropoff beyond the radius threshold, which we tuned to 1.5 miles. Diminishing returns, so that repeated amenities of the same type contribute less each time and a cluster of restaurants cannot inflate the result on its own. Personalization, so that a user can weight amenities to fit their life, student, commuter, family and so on, through an onboarding questionnaire.
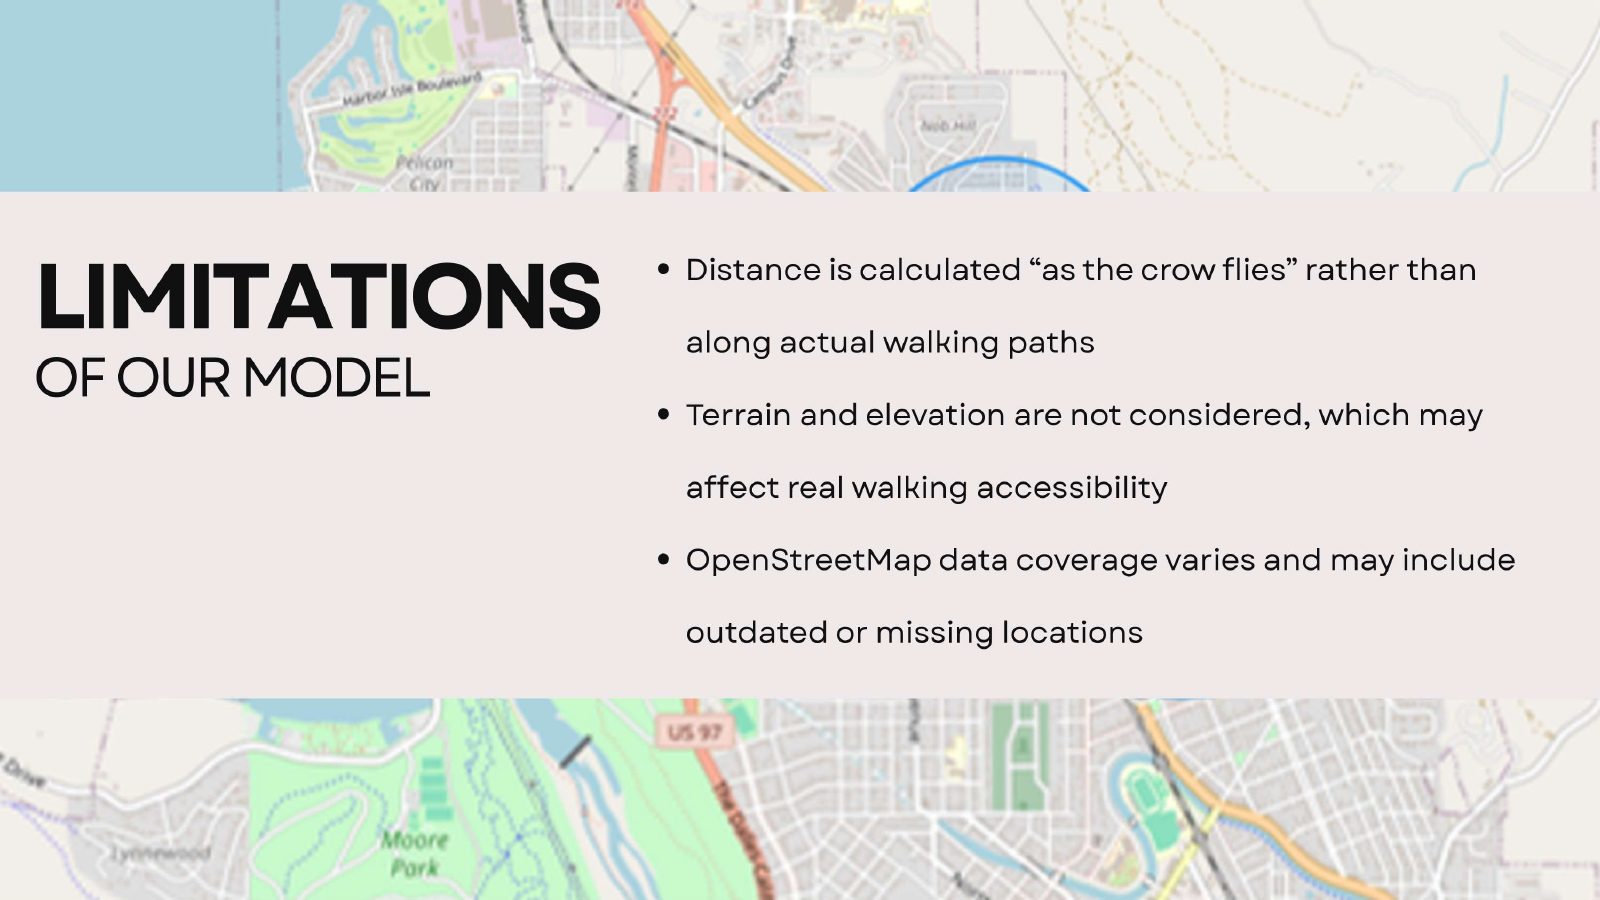
The limitations are stated rather than hidden. Distance is a straight-line radius, not a walking route. Terrain and elevation are not included. OpenStreetMap coverage and accuracy vary by area and by how recently it was updated, and the data can include businesses that have closed or moved.
Process
Five phases, run as a real project
The course asked for a project, and I ran it as one, through the five process groups a project manager is expected to know.
- Initiating. Team formation, the problem statement, the project charter, stakeholder identification, and setting up GitHub and our communication channels.
- Planning. The work breakdown structure, the project schedule, the risk register, the data management plan, and the cadence for talking to our mentor.
- Executing. Data collection, feature development, weekly meetings, progress logs, and peer code reviews.
- Monitoring and controlling. Gantt tracking, risk reviews, mentor check-ins every one to two weeks, and code integrity review.
- Closing. Final deliverables, the presentation, the live demo, and individual reflections from each of us.
What we found
The scoring patterns were telling us about city design
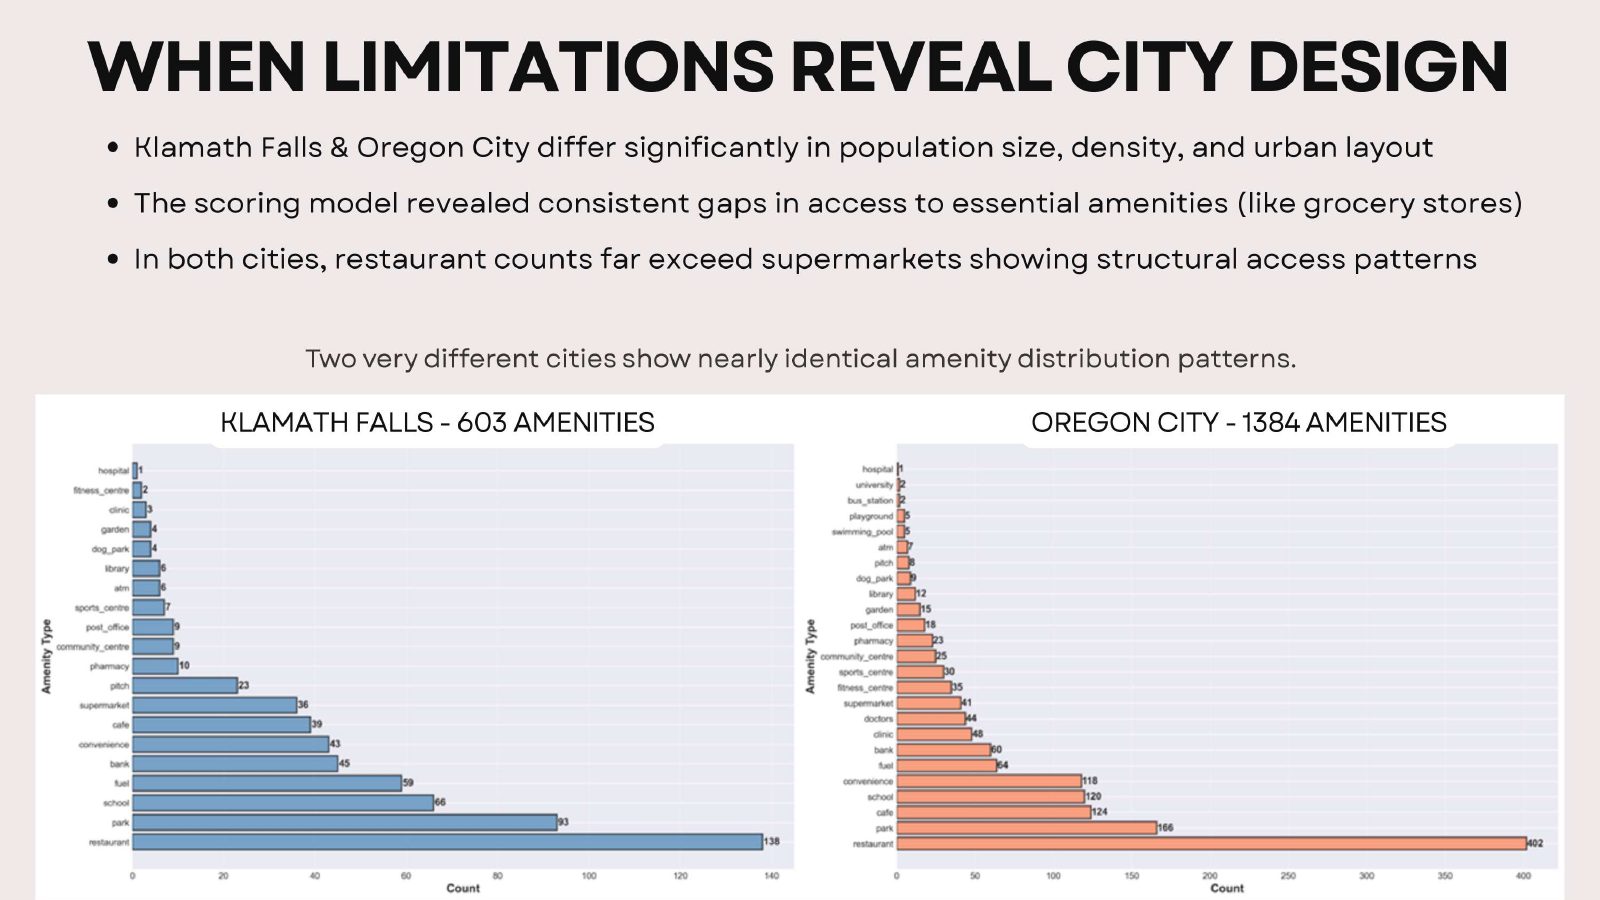
One of the most interesting outcomes was what the model revealed about how cities are built. When we compared amenity distributions across cities of very different sizes, Klamath Falls and Oregon City, the patterns looked surprisingly similar. Restaurants dominate the counts in both, while supermarkets appear far less often, and tend to sit near highways or on large parcels rather than inside neighborhoods.
Some scoring patterns are not model limitations. They accurately reflect how cities are actually built and where services are placed.
So the model does more than score a spot. It surfaces access gaps for daily needs that come from urban planning decisions, which is a finding a proprietary score would never let you see.
The presentation
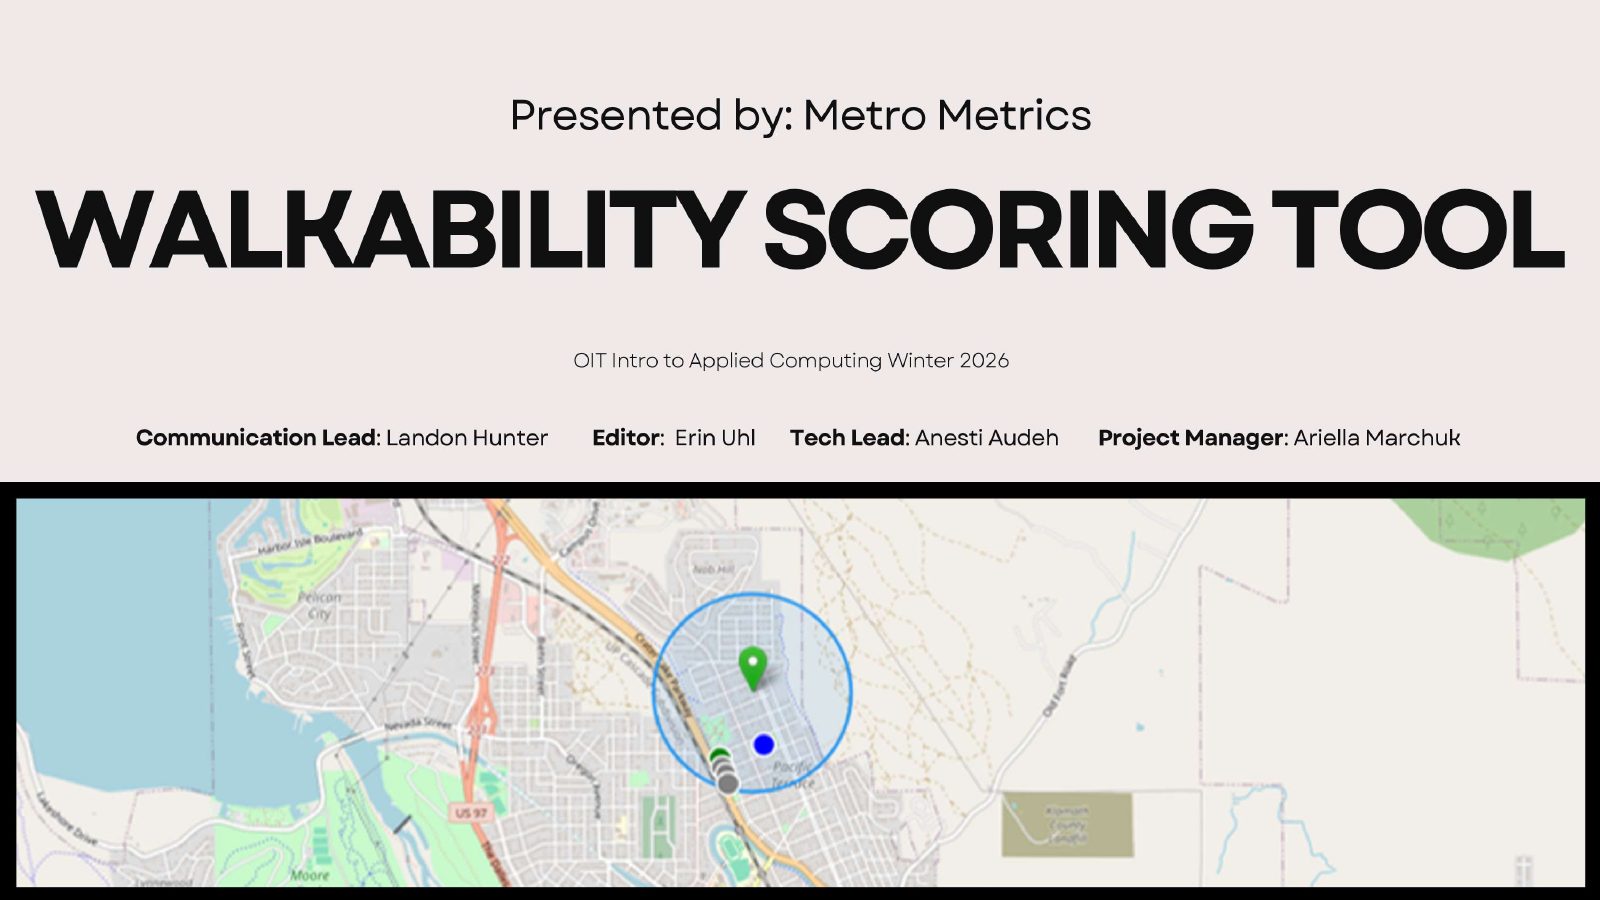
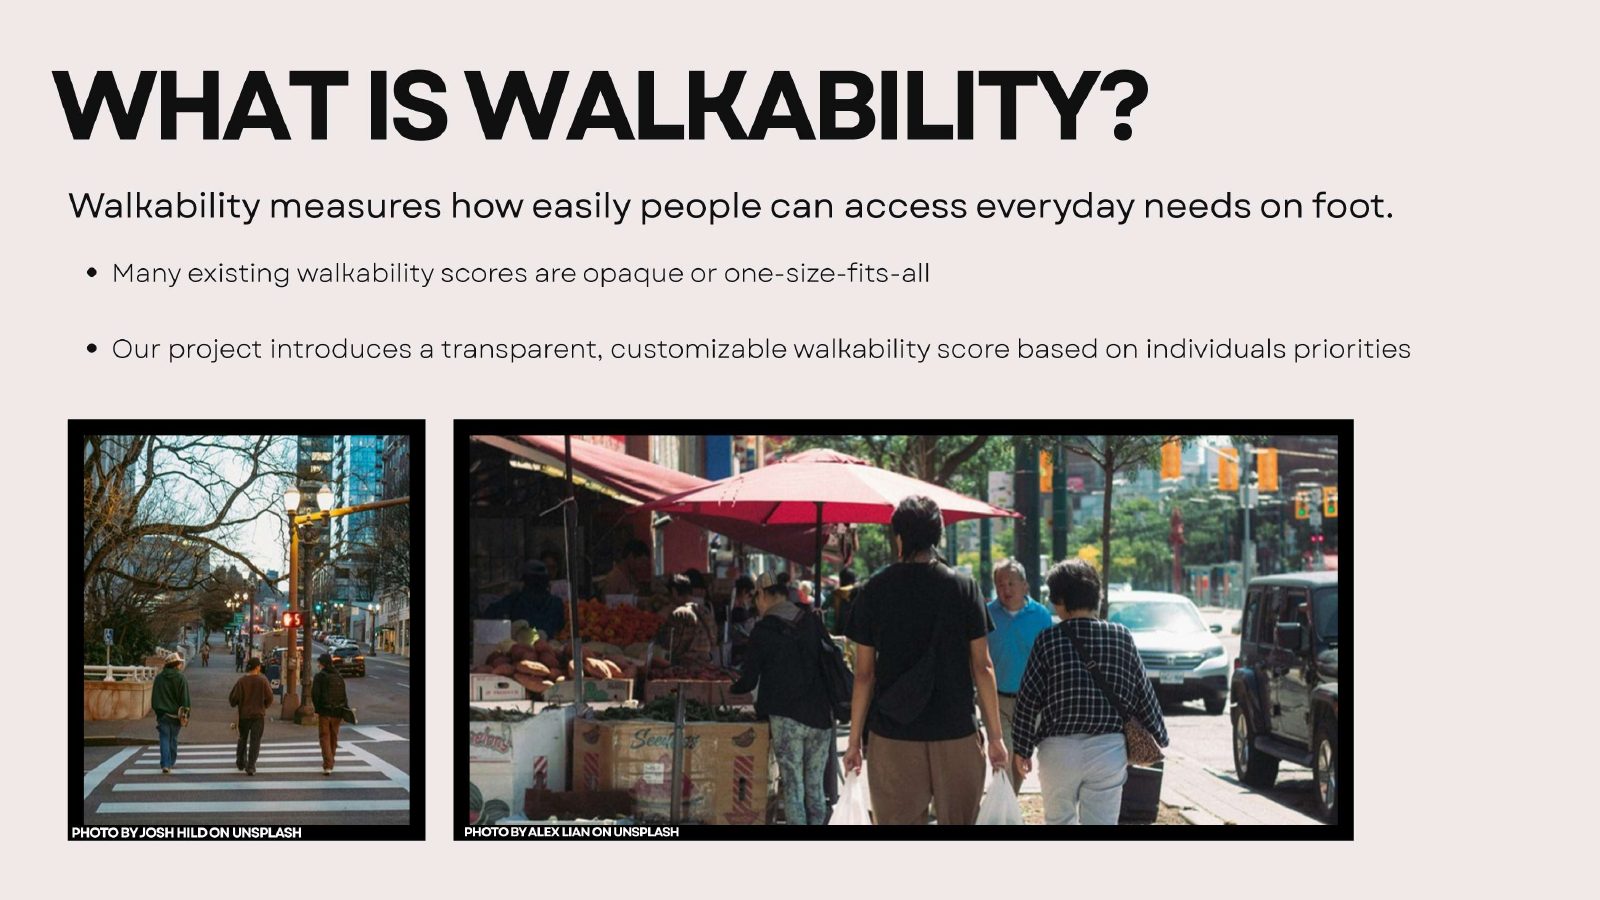
Eleven slides, presented to stakeholders with my team
The codebase
What is in the repository
A Python script generates the interactive map and injects the JavaScript and the stylesheet into it, so the whole tool ships as a single HTML file you open in a browser.
- Generatemain.py
Builds the interactive map and injects walkability.js and styles.css into it. Wait for the map created message, then open the HTML it wrote.
- Score and interactwalkability.js
All of the interactive functionality: amenity retrieval from Overpass, the score calculation, distance weighting, the personalization questionnaire, the UI controls, and data export.
- Stylestyles.css
The UI styling injected into the map.
- Dependenciesrequirements.txt
The Python packages needed to generate the map.
Credit
Who built it
Metro Metrics was built for ENGR 307, Introduction to Applied Computing, at Oregon Institute of Technology in winter 2026, by the five of us named above.